
We’re several years into the AI revolution, and organizations are only now gaining real visibility into AI’s true costs, how workers use it, and the benefits it delivers for their organizations. What’s still missing, however, are context and benchmarks: Is a 30% AI adoption rate good? Is spending six figures on AI licenses and infrastructure each month in line with the broader market? And how many hours should workers realistically expect to save by using AI?
To help tech leaders understand how their AI investments compare with industry peers and other organizations of similar sizes, we’ve compiled this list of benchmarks. The data here is based on real-world responses from U.S. tech leaders collected in Q3 2026 and represents a snapshot of where organizations and industries stand in terms of AI spending, adoption, abandonment, productivity, training, and even their ability to realize positive ROI from AI investments.
Dig into the benchmarks below, or visit the AI Value Navigator to compare your organization to its industry peers.
Why Use the AI Value Navigator?
Designed to take the guesswork out of AI implementation planning, reporting, and more, the AI Value Navigator gives tech leaders detailed, defensible P&L-level metrics they can share with the C-suite. It uses your own real-world estimates of costs and projected benefits, use cases, and more to calculate potential 1-year net ROI on AI spending.
Users also see side-by-side comparisons of how their organization’s AI strategy compares to others in their industry, including spending, adoption, and procurement approach. Try the AI Value Navigator now, or keep scrolling to the latest AI benchmarks.
Jump to:
I. AI Maturity
V. AI-Driven Productivity Benchmarks
VII. AI ROI Benchmarks
I. AI Maturity
To quantify organizations’ AI journeys to date, Eliassen developed a maturity model based on four distinct areas:
-
AI Adoption Across the Enterprise
-
AI Tools and Business Impact
-
AI Policies and Governance
- Data and Decision-Making
This simple model weighted answers to four questions, with the fewest points awarded to organizations that have done little — or no — experimentation with AI, and the most to organizations with smart strategies, sophisticated policies, and empowered governance. Aggregate scores would place organizations into one of our four maturity categories:
-
1-5: Exploring
-
6-12: Experimenting
-
13-21: Operational
-
22+: Scaled
We expected to see a wide distribution of scores across industries and revenue bands. What we found instead was as surprising as it was encouraging.
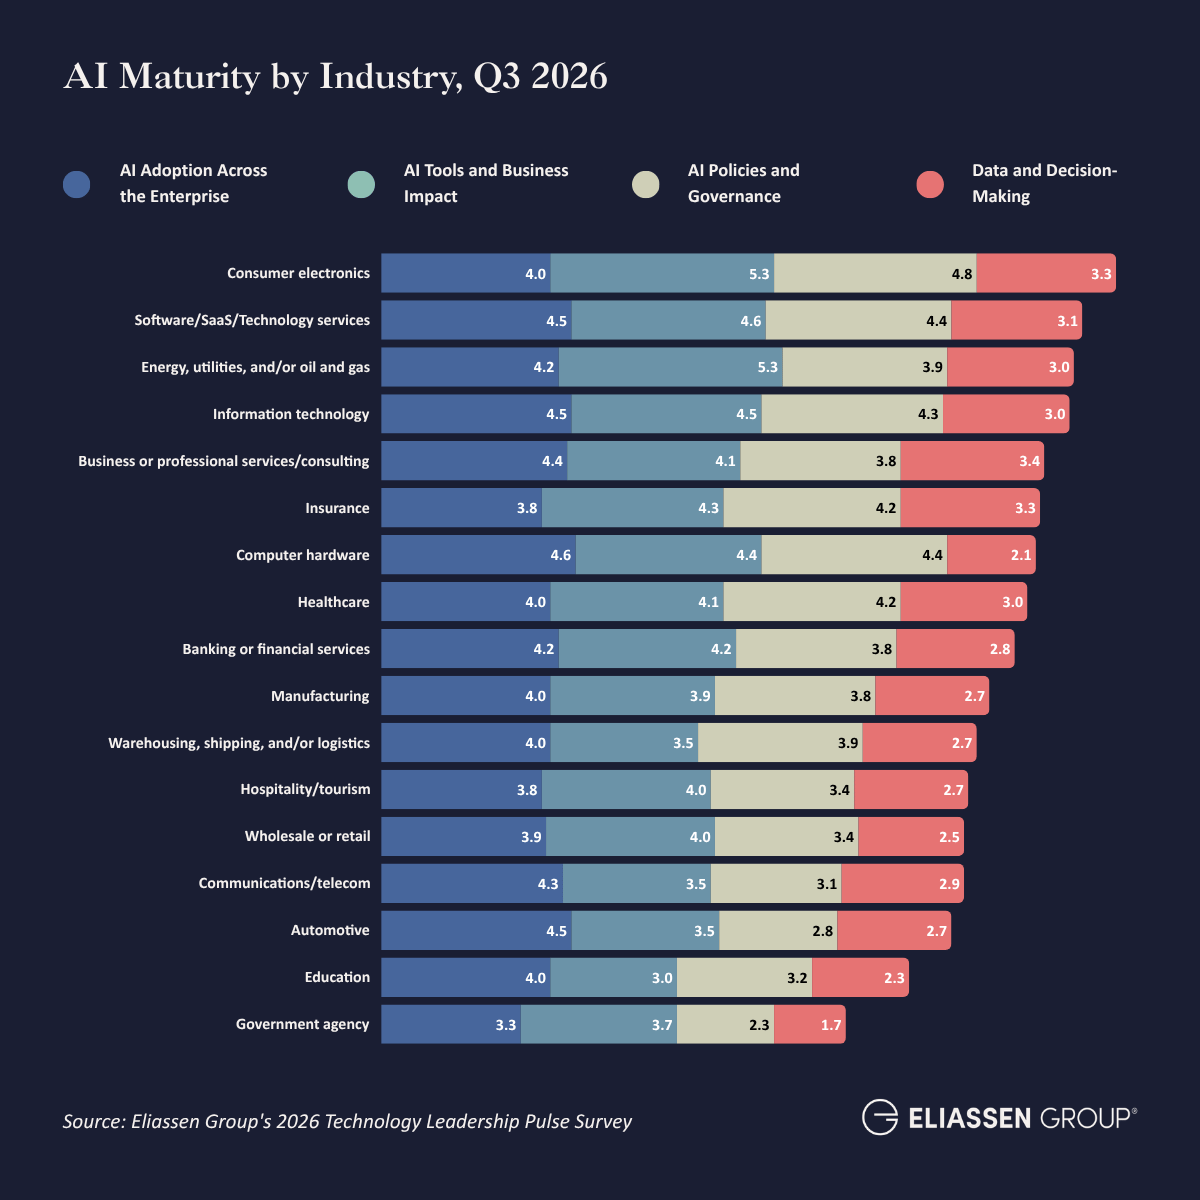
AI Maturity Differs Little Across Industries
Despite all the possible gradations within our model, no single industry dramatically outperformed or underperformed the rest. In fact, almost all industries fell into the “Operational” category, the second-highest available. Only two industries — education and government agencies — fell into the “Experimenting” category, likely due to limited budgets, regulations, and lengthy procurement cycles. No industry reached the highest category (“Scaled”) or fell to the lowest (“Exploring”).
The Smallest Organizations Show One Key Blindspot
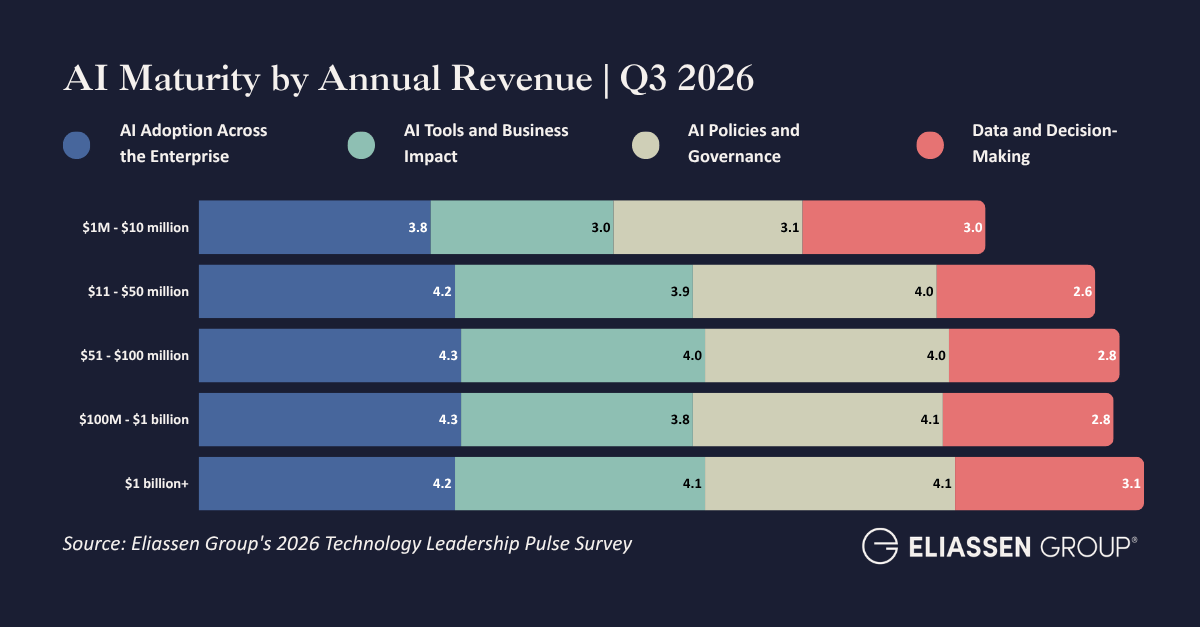
When companies were aggregated by revenue bands, rather than by industry, differences became clearer — and more predictable.
The smallest companies, with annual revenues in the $1M-$10M range, fell within the “experimenting” range, though only just. While their scores in every other category aligned with those of larger organizations, they notably fell short in the “Policies and Governance” category. This likely means that, while they’re eagerly adopting AI and spending heavily, they aren’t investing in the governance infrastructure required for long-term success.
It’s also worth noting that the data and decision-making aspect of AI maturity is the consistent weak point across all revenue bands.
II. AI Spending (Licenses and Infrastructure)
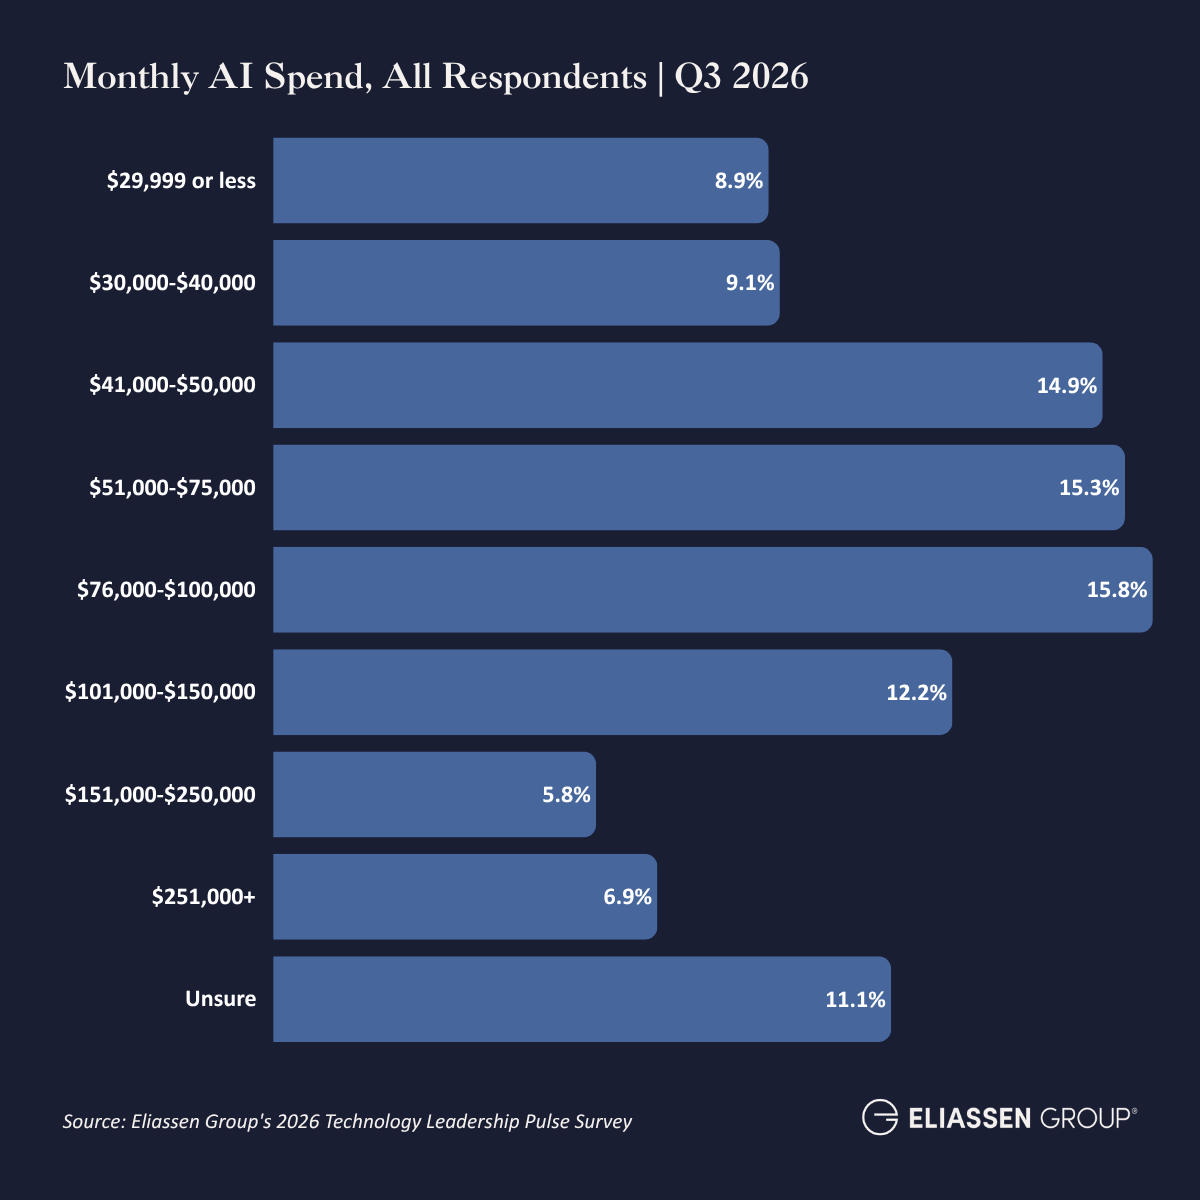
While there may not be overwhelming differences in AI maturity from one industry to the next, one area where organizations across industries and revenue bands clearly differ is in their willingness and ability to spend on AI solutions.
As of Q3 2026, U.S. organizations surveyed spend a median1 of $69,300 a month on AI licenses and infrastructure. Respondents from industries like computer hardware and business and professional services reported spending roughly $85,000 a month on AI licenses and infrastructure, while those from the automotive and education sectors are spending less than half of that ($35,000).
When examined by annual revenue, the differences in AI spending become even more pronounced. Median monthly spend reported by the smallest organizations comes to almost $45K, while enterprise organizations — those in the $1B+ range — reported spending almost three times that ($119,000). Among those enterprise respondents, almost a quarter reported spending $250,000 or more on AI each month.
Monthly AI Spend Benchmarks by Industry
| Industry | Median Monthly AI Spend (Licenses & Infrastructure) |
| Computer hardware | $85,000 |
| Business or professional services | $84,000 |
| Information technology | $81,143 |
| Software/SaaS/Technology services | $79,429 |
| Banking or financial services | $79,000 |
| Warehousing, shipping, and/or logistics | $67,000 |
| Healthcare | $66,000 |
| Energy, utilities, and/or oil and gas | $63,000 |
| Hospitality/tourism | $63,000 |
| Manufacturing | $59,727 |
| Consumer electronics | $59,000 |
| Insurance | $50,000 |
| Communications/telecom | $47,000 |
| Government agency | $47,000 |
| Wholesale or retail | $45,500 |
| Education | $42,125 |
| Automotive | $35,000 |
Monthly AI Spend Benchmarks by Annual Revenue
| Company Revenue | Median Monthly AI Spend (Licenses & Infrastructure) |
| $1M - $10 million | $44,750 |
| $11M - $50 million | $52,000 |
| $51M - $100 million | $66,625 |
| $100M - $1 billion | $81,778 |
| $1 billion+ | $118,500 |
III. AI Adoption
Leaders across industries may seem equally bullish on AI, but their workforces haven’t adopted it in equal measure. Some industries, like professional services and SaaS, report nearly half of employees using at least one AI solution each week. Those in education, wholesale/retail, and government agencies, on the other hand, said that 20% of workers or fewer use AI weekly.
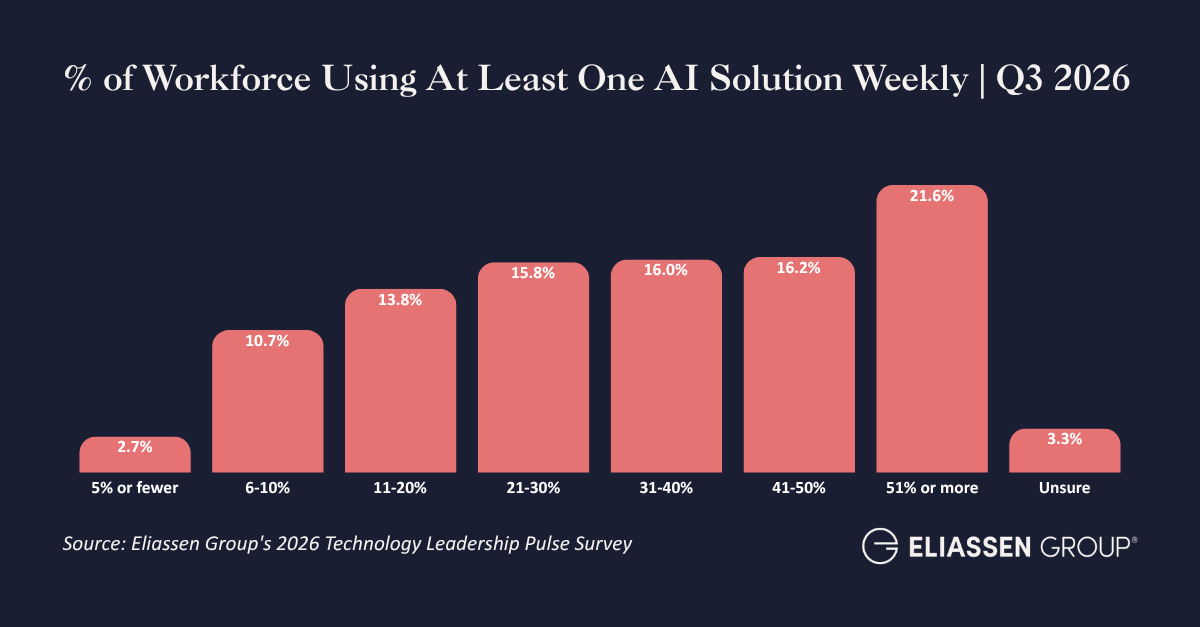
However, adoption rates alone don’t tell the whole story.
Many wholesale/retail workers’ work takes place in stores and in warehouses and distribution centers, where accessing AI may not be possible or preferable. Education and government agencies, too, have their own obstacles to AI use, ranging from regulations to the fact that AI in education is a hotly debated topic — and likely will remain so for the foreseeable future.
Meanwhile, enterprise organizations may be spending 45% more on AI than the next-largest cohort of companies, but that spending hasn’t translated into greater adoption rates. Enterprise organizations report that only about a third of their workforce uses an AI solution each week, compared to the 40% of employees at upper mid-market companies who utilize AI at the same frequency.
AI Adoption Benchmarks by Industry
| Industry | Median % of Workers Using AI Solutions Weekly |
| Business or professional services | 46.7% |
| Software/SaaS/Technology services | 45.6% |
| Insurance | 41.7% |
| Banking or financial services | 39.0% |
| Hospitality/tourism | 37.5% |
| Consumer electronics | 35.0% |
| Information technology | 34.8% |
| Computer hardware | 32.5% |
| Energy, utilities, and/or oil and gas | 32.5% |
| Manufacturing | 28.6% |
| Automative | 27.5% |
| Warehousing, shipping and/or logistics | 25.7% |
| Communications/telecom | 25.0% |
| Healthcare | 25.0% |
| Education | 20.0% |
| Government agency | 20.0% |
| Wholesale or retail | 10.0% |
AI Adoption Benchmarks by Annual Revenue
| Company Revenue | Median % of Workers Using AI Solutions Weekly |
| $1M - $10 million | 26.4% |
| $11M - $50 million | 30.5% |
| $51M - $100 million | 33.2% |
| $100M - $1 billion | 40.4% |
| $1 billion+ | 32.5% |
IV. AI Abandonment
Much has been made of AI-failure statistics, like MIT’s widely reported finding that “95% of AI pilots delivered no measurable return.” But AI has made great leaps since those initial findings were reported in July 2025, and many companies have moved beyond just experimenting with AI and are now making it part of their real-world workflows.
Eliassen’s research found that just over a quarter (26%) of all respondents said their organizations had given up on an AI solution after building, buying, and/or implementing it, while 67% said their organizations had never abandoned an AI solution. That may be due, at least in large part, to the fact that most organizations came relatively late to the AI party, while a small number of early adopters took experimental, scattershot approaches to AI, most of which ultimately failed to deliver meaningful results.
Abandonment still happens, of course, but the ambitious failures experienced by early adopters have largely given way to more cautious and strategic implementations.
AI Abandonment Benchmarks by Industry
| Industry | Percent of Organizations That Have Abandoned at Least One AI Solution |
| Information technology | 41.5% |
| Software/SaaS/Technology services | 34.8% |
| Consumer electronics | 33.3% |
| Insurance | 33.3% |
| Computer hardware | 30.0% |
| Hospitality/tourism | 22.2% |
| Communications/telecom | 20.0% |
| Wholesale or retail | 18.2% |
| Automative | 16.7% |
| Business or professional services/consulting | 16.7% |
| Manufacturing | 16.7% |
| Healthcare | 15.8% |
| Energy, utilities, and/or oil and gas | 15.4% |
| Warehousing, shipping and/or logistics | 14.8% |
| Banking or financial services | 14.3% |
| Government agency | 11.1% |
| Education | 10.5% |
AI Abandonment Benchmarks by Annual Revenue
| Company Revenue | Percent or Organizations That Have Abandoned at Least One AI Solution |
| $1M - $10 million | 29.0% |
| $11M - $50 million | 26.8% |
| $51M - $100 million | 28.8% |
| $100M - $1 billion | 22.5% |
| $1 billion+ | 25.7% |
V. AI-Driven Productivity Gains
Spending and adoption are strong indicators of how an organization thinks about and prioritizes AI. But what are they getting in return?
At a high level, our survey found that organizations save 12 hours per worker per week as a result of AI (median). That annualizes to about 600 working hours per AI user per year — obviously a huge boost to productivity.
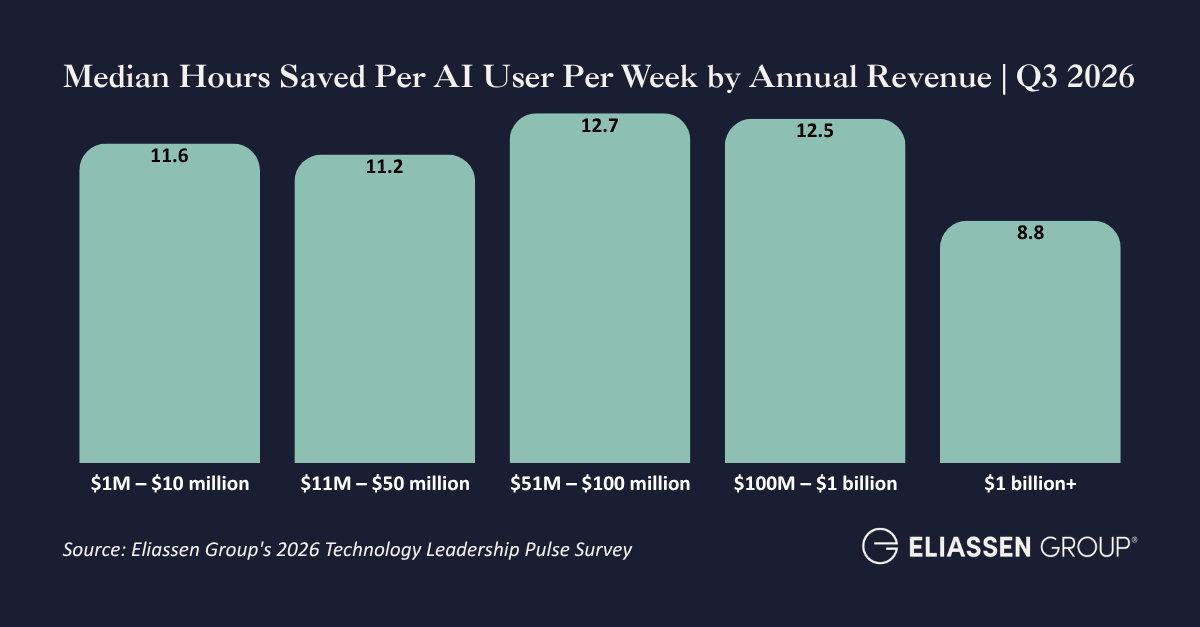
Surprisingly, one factor that doesn’t closely correlate with the largest boost in productivity is spending. Take the enterprise segment, for example: Despite outspending every other revenue band on AI licenses and infrastructure, their leaders report just 8.8 hours per week saved, which is significantly less than the almost 12 hours saved by the smallest organizations in our survey.
Likewise, while some industries that spend heavily on AI report significant productivity gains, this correlation is far from universal. Leaders from consumer electronics, for example, report spending $59,000 per month on AI — nowhere near the top of the list — but they also report receiving the largest productivity boost. Computer hardware leaders, on the other hand, are spending the most on AI of any industry, but report saving the ninth-most hours as a result.
Because so many variables impact AI’s ability to save workers time, like adoption, training, use cases, and effectiveness of the AI solutions themselves, the takeaway here is clear: Organizations can’t simply spend their way to AI-powered productivity gains.
AI Productivity Benchmarks by Industry
| Industry | Work Hours Saved Per AI User Per Week |
| Consumer electronics | 16.2 |
| Business or professional services | 14.2 |
| Automative | 13.8 |
| Banking or financial services | 12.8 |
| Information technology | 12.2 |
| Warehousing, shipping and/or logistics | 11.9 |
| Manufacturing | 11.4 |
| Software/SaaS/Technology services | 11.4 |
| Computer hardware | 11.2 |
| Insurance | 10.8 |
| Wholesale or retail | 10.8 |
| Energy, utilities, and/or oil and gas | 10.6 |
| Healthcare | 9.8 |
| Communications/telecom | 8.3 |
| Hospitality/tourism | 8.3 |
| Government agency | 6.9 |
| Education | 5 |
AI Productivity Benchmarks by Annual Revenue
| Company Revenue | Work Hours Saved Per AI User Per Week |
| $1M - $10 million | 11.6 |
| $11M - $50 million | 11.2 |
| $51M - $100 million | 12.7 |
| $100M - $1 billion | 12.5 |
| $1 billion+ | 8.8 |
VI. AI Training
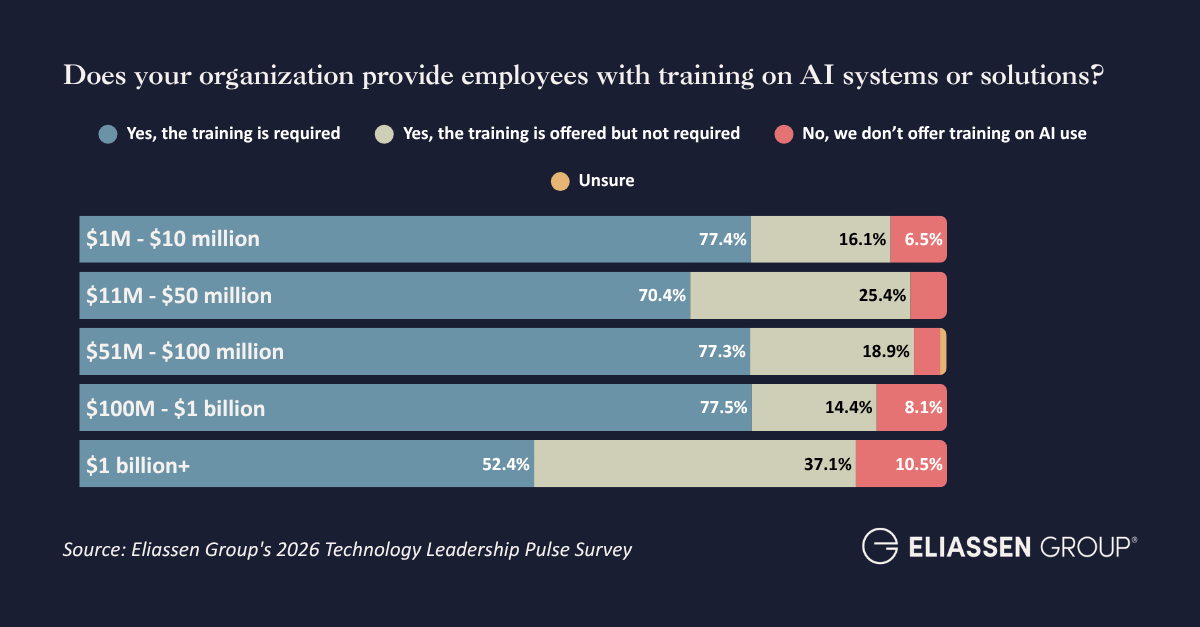
Organizations may be spending heavily on AI solutions, but not all have invested equally in training workers to actually use them. While the vast majority of respondents — 71% — said that AI training is mandatory within their organizations, 23% said it was offered but not required, and just over 6% said it wasn’t offered at all.
The enterprise segment presents yet another mystery here: Only 52% of $1B+ companies require AI training for AI users. In every other revenue segment, that number is more than 70%. While this may be a result of the sheer size of enterprise workforces, it’s also likely to be a contributing factor to the lower adoption rates and reduced productivity gains reported by enterprise companies.
AI Training Benchmarks by Industry
| Industry | % of Workforce That Has Completed AI Training (Median) |
| Computer hardware | 45.0% |
| Communications/telecom | 43.3% |
| Software/SaaS/Technology services | 42.8% |
| Banking or financial services | 42.3% |
| Business or professional services | 40.8% |
| Information technology | 40.6% |
| Automative | 40.0% |
| Energy, utilities, and/or oil and gas | 40.0% |
| Warehousing, shipping and/or logistics | 37.5% |
| Manufacturing | 37.1% |
| Government agency | 35.0% |
| Hospitality/tourism | 35.0% |
| Insurance | 35.0% |
| Consumer electronics | 32.5% |
| Wholesale or retail | 32.5% |
| Healthcare | 31.4% |
| Education | 30.0% |
AI Training Benchmarks by Annual Revenue
| Company Revenue | % of the Workforce That Has Completed AI Training (Median) |
| $1M - $10 million | 32.5% |
| $11M - $50 million | 41.4% |
| $51M - $100 million | 38.0% |
| $100M - $1 billion | 40.7% |
| $1 billion+ | 25.7% |
VII. ROI from AI Solutions
For most organizations, the days of free-spending AI experimentation are likely over. As AI solutions mature and as real-world use cases become more defined, CFOs increasingly expect CTOs and other tech leaders to treat AI like any other tech solution.
In other words, they’re looking for evidence-backed ROI.
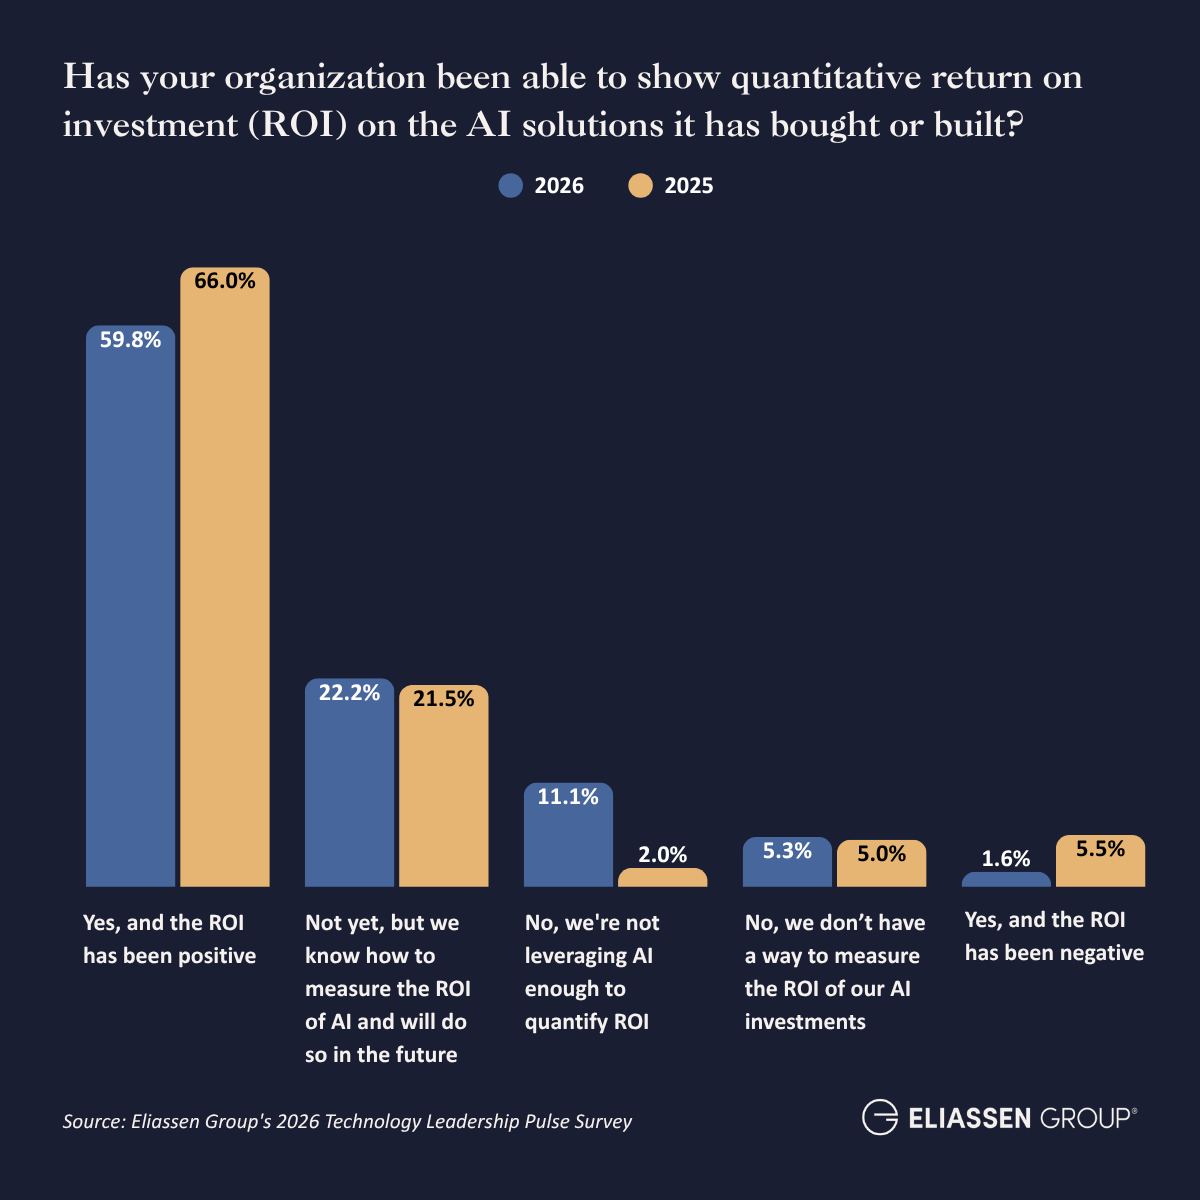
When we first asked tech leaders about their ability to connect AI investments to ROI in late 2025, the results were surprising: 66% said they were already able to attribute positive ROI to their investments in AI. When we asked that same question again six months later, that number dropped — though only somewhat — to 60%. However, that may actually be good news.
A moderate decline in positive ROI likely correlates to organizations improving their ability to accurately measure the ROI of their AI investments.
It also likely correlates to a more realistic view of AI’s ability to impact productivity, revenue, and innovation. This assumption is bolstered by the fact that the share of leaders who said that they don’t know enough to quantify their ROI yet increased from 2% in Q4 2025 to 11% in Q3 2026.
In short, this change is likely less about AI itself and more about increased AI maturity.
AI ROI Benchmarks by Industry
| Industry | Yes, and the ROI has been positive | Not yet, but we know how to measure the ROI of AI solutions and will do so in the future | No, we're not leveraging AI enough to quantify ROI | No, we don't have a way to measure the ROI of our AI investments | Yes, and the ROI has been negative |
| Automotive | 33.3% | 33.3% | - | - | 33.3% |
| Banking or financial services |
7.1% | 3.6% | 32.1% | 3.6% | 53.6% |
| Business or professional services |
- | - | 38.9% | - | 61.1% |
| Communication /telecom |
- | - | 30.0% | - | 70.0% |
| Computer hardware | 20.0% | 10.0% | 10.0% | - | 60.0% |
| Consumer electronics | - | - | 16.7% | - | 83.3% |
| Education | 15.8% | 42.1% | 31.6% | - | 10.5% |
| Energy, utilities, and/or oil and gas | 7.7% | 7.7% | 15.4% | 7.7% | 61.5% |
| Government agency | 11.1% | 44.4% | 11.1% | - | 33.3% |
| Healthcare | 5.3% | 13.2% | 28.9% | - | 52.6% |
| Hospitality /tourism |
- | 22.2% | 22.2% | - | 55.6% |
| Information technology | 1.5% | 8.5% | 16.9% | 1.5% | 71.5% |
| Insurance | - | 16.7% | 33.3% | - | 50.0% |
| Manufacturing | 11.9% | 11.9% | 19.0% | 2.4% | 54.8% |
| Software/SaaS /Technology services |
4.3% | 4.3% | 10.9% | 4.3% | 76.1% |
| Warehousing, shipping and/or logistics | 3.7% | 7.4% | 37.0% | - | 51.9% |
| Wholesale or retail | 4.5% | 18.2% | 27.3% | - | 50.0% |
AI ROI Benchmarks by Annual Revenue
| Company Revenue | Yes, and the ROI has been positive | Not yet, but we know how to measure the ROI of AI solutions and will do so in the future | No, we're not leveraging AI enough to quantify ROI | No, we don't have a way to measure the ROI of our AI investments | Yes, and the ROI has been negative |
| $1M - $10 million | 48.4% | 35.5% | 3.2% | 9.7% | 3.2% |
| $11M - $50 million | 66.2% | 16.9% | 9.9% | 5.6% | 1.4% |
| $51M - $100 million | 62.9% | 18.2% | 12.9% | 4.5% | 1.5% |
| $100M - $1 billion |
64.0% | 18.9% | 10.8% | 6.3% | - |
| $1 billion+ | 50.5% | 30.5% | 10.5% | 5.7% | 2.9% |
Takeaways for Tech Leaders
Despite the interest and investment in AI, we’re still in the very early days of the AI revolution. As such, the benchmarks presented here will likely look very different six months or a year from now. But until a more defined roadmap emerges, these benchmarks can help tech leaders get a clearer picture of where their organizations stand within the broader market.
However, some lessons are already becoming clear:
-
Organizations can’t spend their way to AI maturity, and investment alone doesn’t lead to increased adoption or productivity benefits. Real ROI and increased maturity require strategy, clearly defined use cases, and staff training.
-
The optimism around AI hasn’t gone away, but it has been tempered by reality. Organizations are no longer measuring AI’s impact in “vibes” and are instead beginning to tie its impact to real business outcomes.
-
Enterprise companies are pouring resources into AI, but they may want to consider examining what they’re getting in return — and how they set up AI users for success. Despite spending the most on AI, these organizations report saving the least amount of time per employee and are least likely to require training for AI users.
-
For organizations in regulated industries and those with lengthy, restrictive procurement cycles, broad adoption and the benefits that come with it may not materialize for some time. Companies that serve these sectors, like those in GovTech and EdTech, shouldn’t equate lack of investment, maturity, or adoption as a lack of interest.
To build a better understanding of how your organization compares to others in your industry and revenue range, explore Eliassen’s AI Value Navigator tool. It enables tech leaders to compare their own AI efforts against industry-specific benchmarks and provides clear ROI data based on your costs, adoption rates, and use cases.