If you're looking for a value stream example, look no further than the familiar expression ‘the whole enchilada.’ This phrase implies that one should look at the whole situation, the whole picture rather than just focusing on the individual components of the metaphorical enchilada. Whether it is Mexican food or life, the whole is ideally greater than the sum of its parts.
Why an Enchilada Is the Perfect Value Stream Example
Let's start with understanding value streams first. As a kid in high school, I was a big fan of sneaking off campus to eat at Taco Bell with my friends. Part of it was the adventure, and part of it was indulging in a burrito supreme, a hard shell taco, and the occasional “enchirito.” During one of these forays, I deconstructed my burrito into its individual components and realized that each individual component, such as the “meat-like” substance or radioactive colored cheese, were not that great in and of themselves. It’s not until you put all of these toxic ingredients together and heat them that pure fast food magic is realized.
The approach of looking at the whole enchilada rather than just the individual components of beans, cheese, etc. should be taken by organizations who want to improve the flow of value to their customers. Often times, organizations only look at one part of their delivery process, such as development or operations, and attempt to optimize it, such as by introducing DevOps, without determining if they have actually reduced the overall time it takes to transform a customer request or business need into realized value.
Lean Value Stream Mapping Overview
Lean value stream mapping allows us to take a holistic, end-to-end view of how customer needs are transformed into value delivered. It’s worth exploring the value in the lean technique of value stream mapping. Value Stream Mapping is defined as:
“Value stream mapping is a lean manufacturing or lean enterprise technique used to document, analyze and improve the flow of information or materials required to produce a product or service for a customer …
A value stream map (AKA end-to-end system map) takes into account not only the activity of the product, but the management and information systems that support the basic process. This is especially helpful when working to reduce cycle time, because you gain insight into the decision making flow in addition to the process flow. It is actually a Lean tool.” –isixsigma.com
By identifying the steps required to process a customer request through an organization’s system, Value Streams shine a light on the reality of what it takes to create value within your organization. It illuminates those areas that inject waste in the system, which thereby cause unnecessary delays.
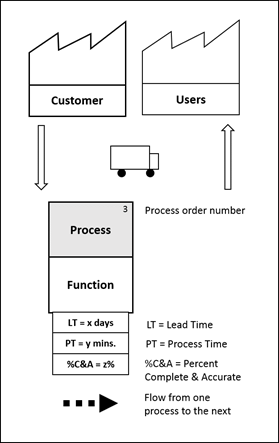
First, let’s begin our discussion on some basic terms and icons we will use in the creation and measurement of our value stream example. Below is a pared down list of terms that Karen Martin cites her book, Value Stream Mapping: How to Visualize Work and Align Leadership for Organizational Transformation, referenced later.
- Lead Time (LT) – Is the elapsed time from the moment the work is made available to those that will work on it and complete it for the next group in the value stream. Also known as throughput time, response time or turnaround time. Expressed in hours or days.
- Total Lead Time (Total LT) – Is the total time it takes to deliver on a customer request.
- Process Time (PT) – Is the time it takes people to complete the process tasks to transform an input into an output for unit of work, such as single functional testing. Also known at processing time or touch time. A batch of work is considered a single unit. Expressed in minutes or hours, process time does not include waiting and delays.
- Total Process Time (Total PT) – Is the total work effort required by all functions on the value stream.
- Value-Adding Effort – Is work that your external customer values and will pay for.
- Non-Value-Adding Effort – All other expenses and effort not considered value-adding.
- Percent Complete & Accurate (%C&A) – Reflects the quality of each process’s output. It is gathered by asking each downstream consumer what percentage of the time they receive work that is ‘usable as is’ without having to correct it.
- Activity Ratio (AR) – Is the degree of flow in the value stream. The larger the number the better.
(Total Process Time/Total Lead Time) x 100 = Activity Ratio
- Rolled %C&A - Is the compounded effect of the quality of output across the value stream.
(%C&A)1 x (%C&A)2 x (%C&A)n x 100 = Rolled %C&A
Below is a legend that captures the basic icons used in our basic value stream mapping examples.
The value stream mapping process can be applied to any process, big or small, from provisioning a laptop for a new hire to launching a product or service. The example below depicts a fictitious software delivery flow that we will use as an example. The illustrations are simple value stream mapping examples that show both the current state and future state of a representative software development process.
The current state value stream mapping example depicts a traditional waterfall development process by denoting each of the major steps in the process.
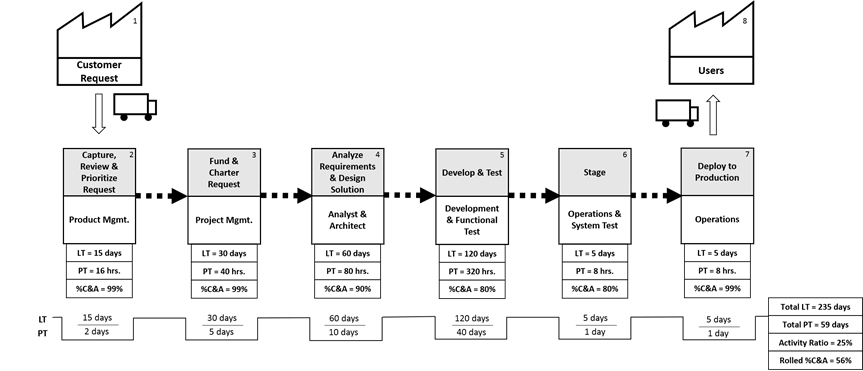
The current state identifies the key steps in transforming a customer request into delivered value. Each key step is analyzed to identify process, who is performing it, the lead time, the processing time, and the percent complete and accurate. The totals are then captured in the table on the bottom right hand side. Notice the Activity Ratio of 25% and Rolled Complete and Accurate of 56%.
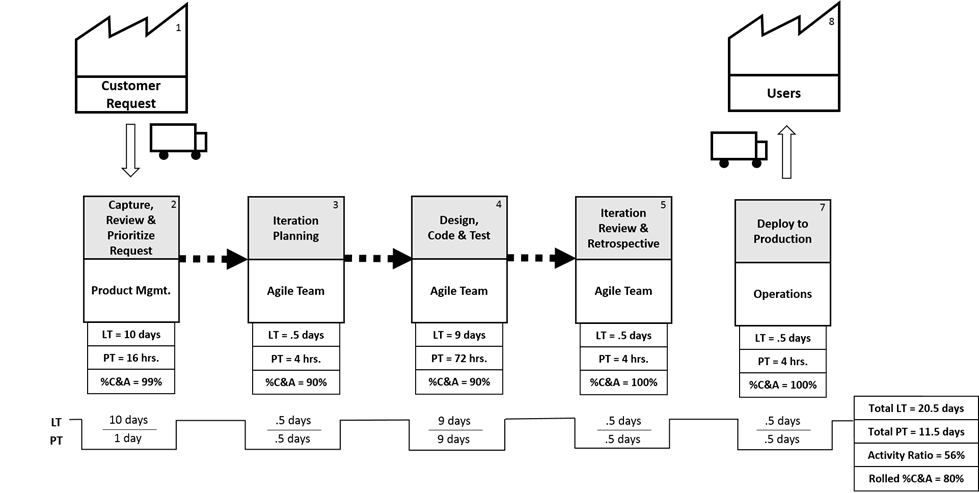
The creation of the future state is a result of analyzing the current state to determine how to reduce Total Lead Time, increase the Activity Ratio %, and increase the Rolled Complete & Accurate %. Below is the diagram for proposed future state using Scrum, an iterative and incremental approach to software development. Notice the overall reduction in Total Lead Time (from 235 days to 20.5 days), the reduction in Total Processing Time (from 59 days to 11.5 days), the increase in Activity Ratio (from 25% to 56%), and the improvement in Rolled % Complete and Accurate (from 56% to 80%).
The challenge for leadership is to now determine what actionable steps are needed to go from the current to the future state.
The Process of Lean Value Stream Mapping
An excellent reference to conduct a formal Lean Value Stream Mapping exercise within your organization to reduce waste and total lead team from customer request to value delivery is Value Stream Mapping: How to Visualize Work and Align Leadership for Organizational Transformation by Karen Martin and Mike Osterling. This book provides more in-depth information on the process employed to create value streams and visual components used.
Part 2 of this blog will focus on a streamlined value stream example to map what happens in your organization. In the meantime, check out the book referenced above, and visit the Eliassen Group website's Agile Consulting section and DevOps section to learn more about how we can help your organization deliver more value, faster to your customers.


-800-by-800%20.png)